Blog
Find out about our research, events and other news from the world of data.

General

Seven Charts That Represent 100%
Choosing the right chart is key to visualizing our data in the clearest and most powerful way …

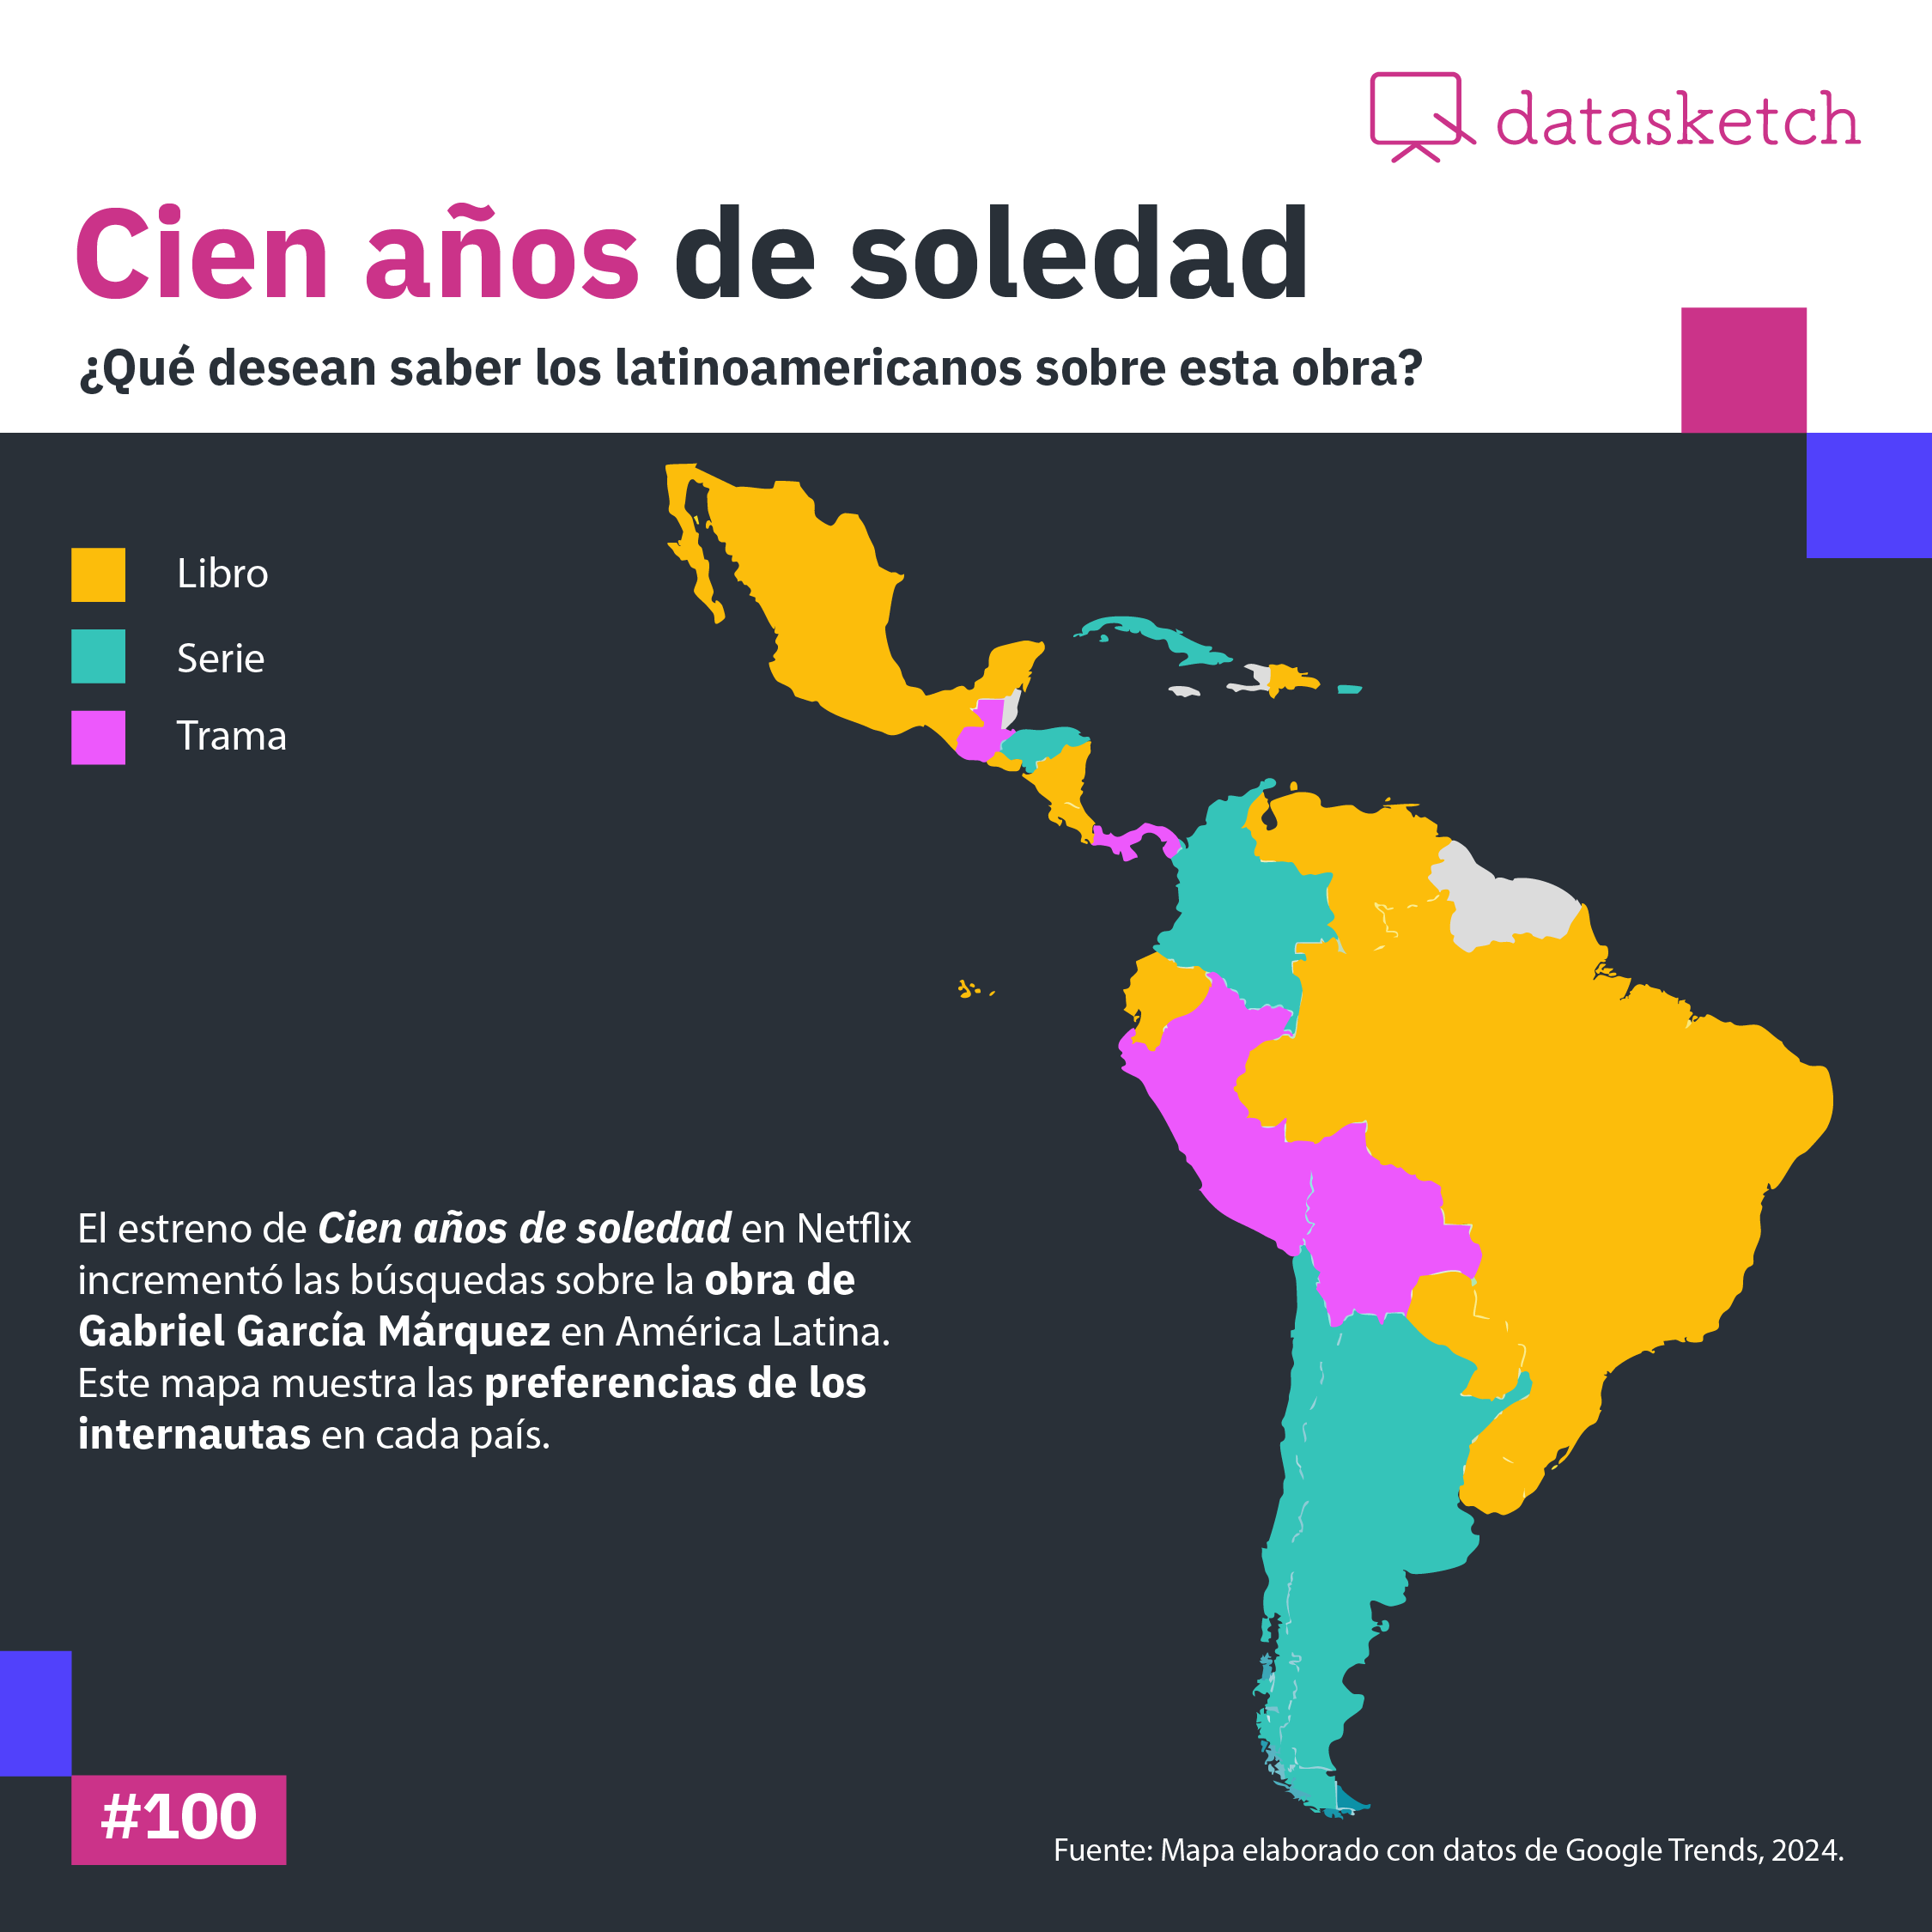
Book or Series? The Interest in Cien años de soledad in Latin America Through Data
The debut of 'Cien Años de Soledad' on Netflix has generated a notable increase in searches related …


Flavors in Data: Discover Traditional Colombian Cuisine's Recipes
Colombian gastronomy knowledge, documented for decades in the Great Book of Colombian Cuisine, …


Data journalism
Huge data requires simple explanations
Story telling | New Perspectives in Communication | Big Data

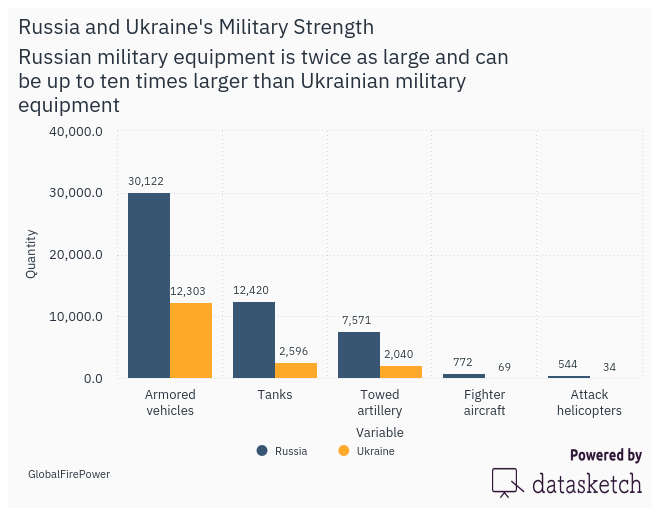
Russia and Ukraine's Military Strength: Same Data, Different Visualizations
The military strength of Russia and Ukraine can have different visualizations. We consider here the …

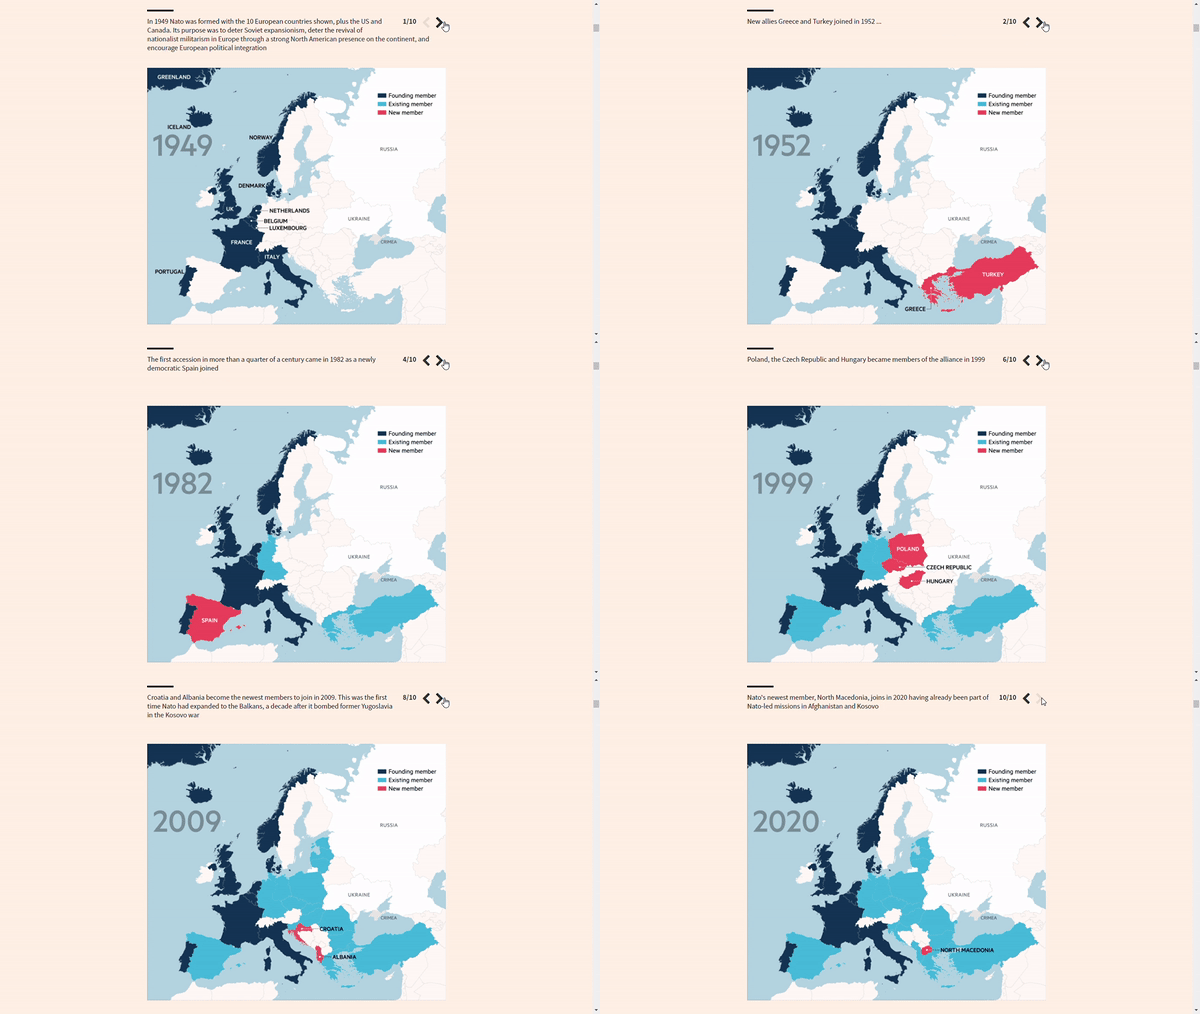
The Visualizations of the Tension Between Russia and Ukraine
The media have focused their attention on the tension between Russia and Ukraine. Their graphics and …


Open government
The Americas in the Corruption Perceptions Index
We have reviewed the results for the countries of the Americas. Now we tell you how we see the …

WEF - Global Risks Report 2023
The World Economic Forum published last week the Global Risks Report 2023. Here are the main …

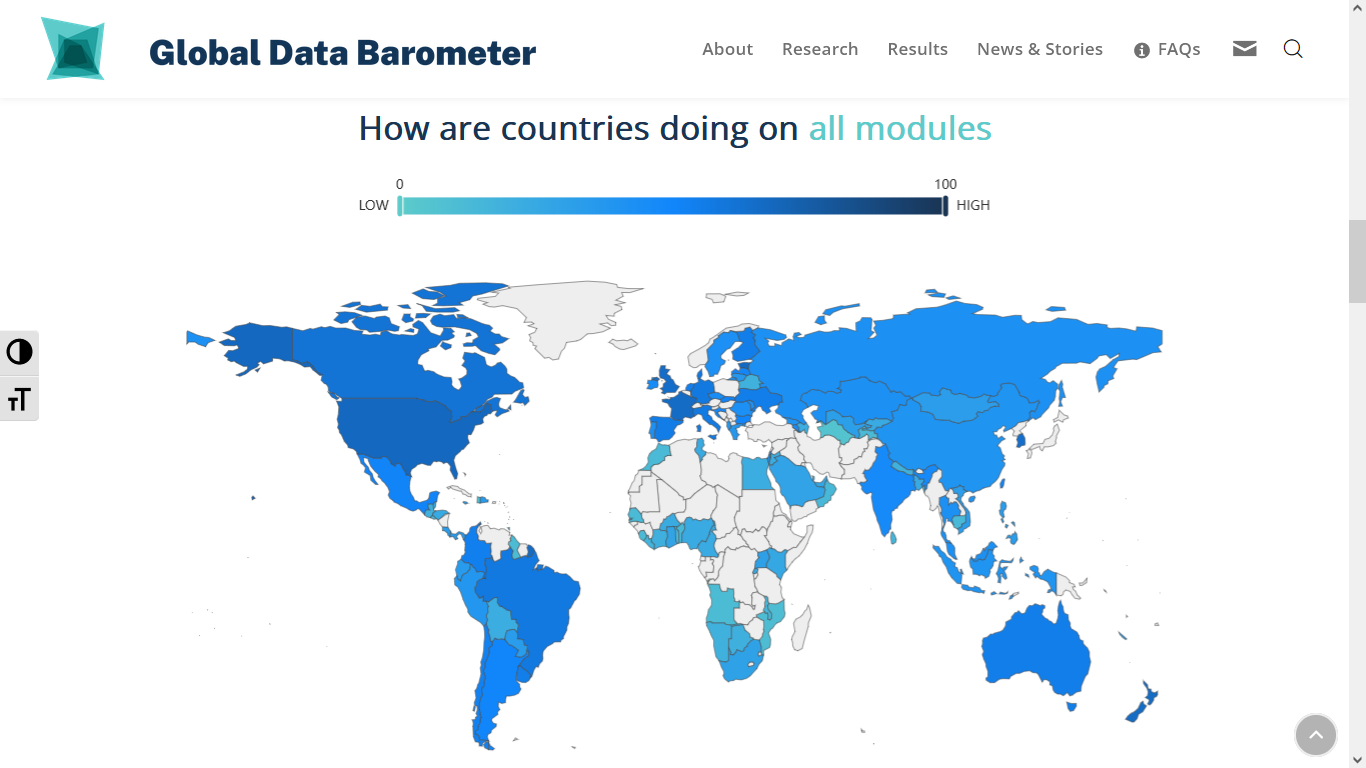
The First Edition of the Global Data Barometer Is Now Available
The first edition of the Global Data Barometer took place on May 11, and Datasketch participated in …


Data culture
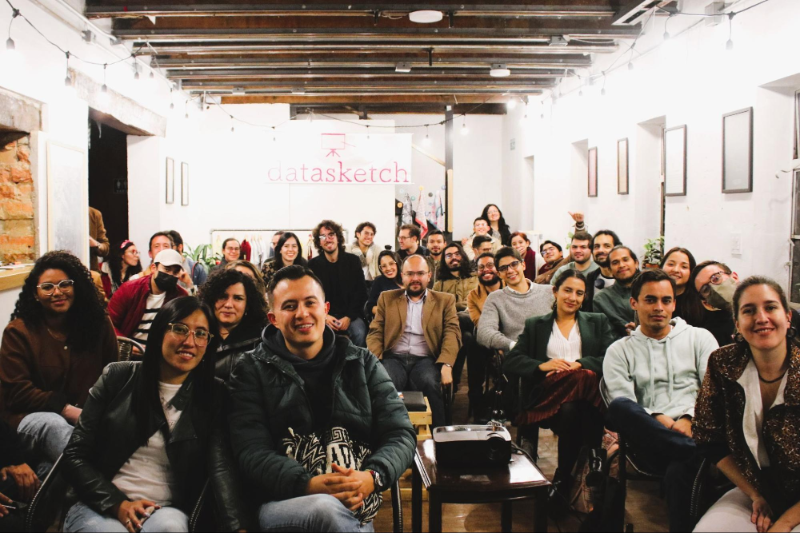
Datos y Guaros: Colombia and the 2022 Pandemic Elections
See the projects presented in the latest edition of our Data and Guaros.

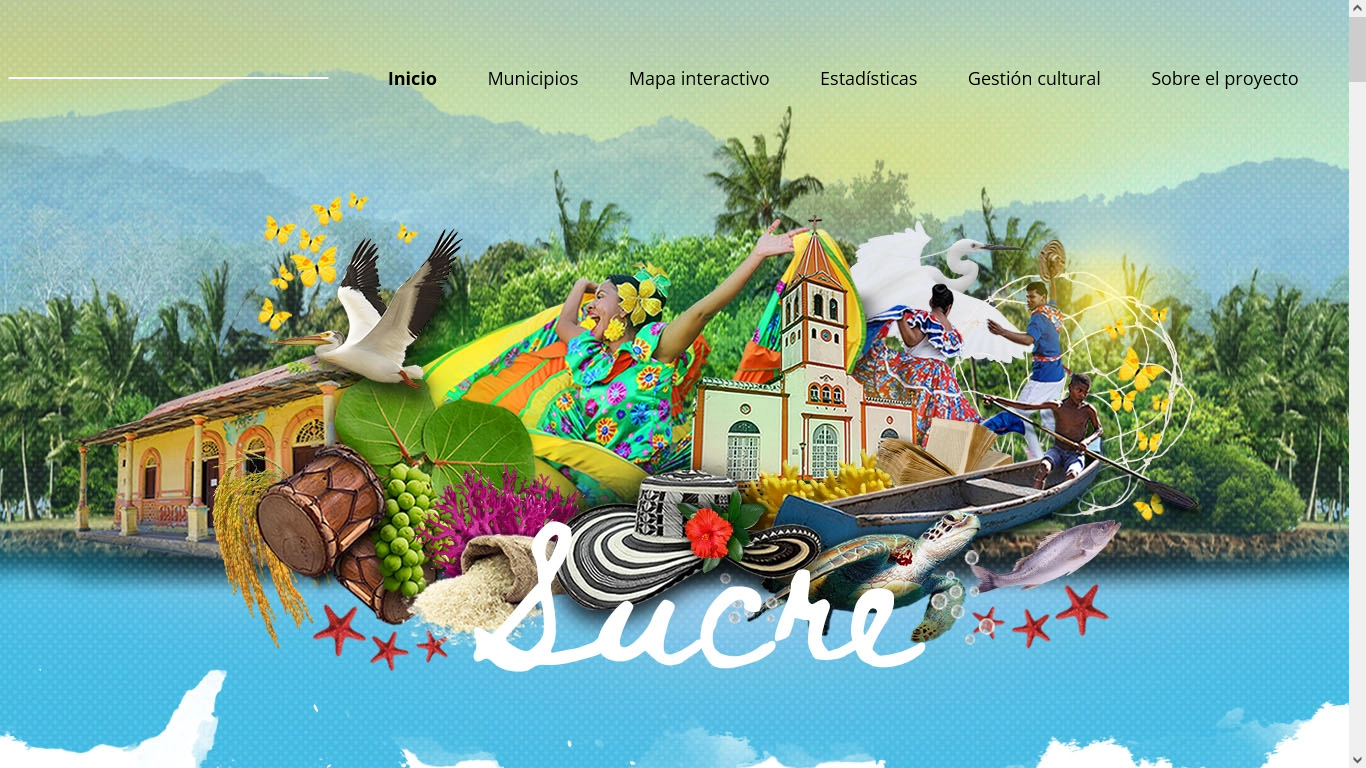
Sucre Cultural Map: A Project with the Datasketch Label
Sucre Information System and Cultural Map had its premiere on May 13. Datasketch worked on data …


Data Culture and Datasketch
Our approach to data culture encompasses open data, algorithmic art, textile art with data, …


