
General

Seven Charts That Represent 100%
Choosing the right chart is key to visualizing our data in the clearest and most powerful way …

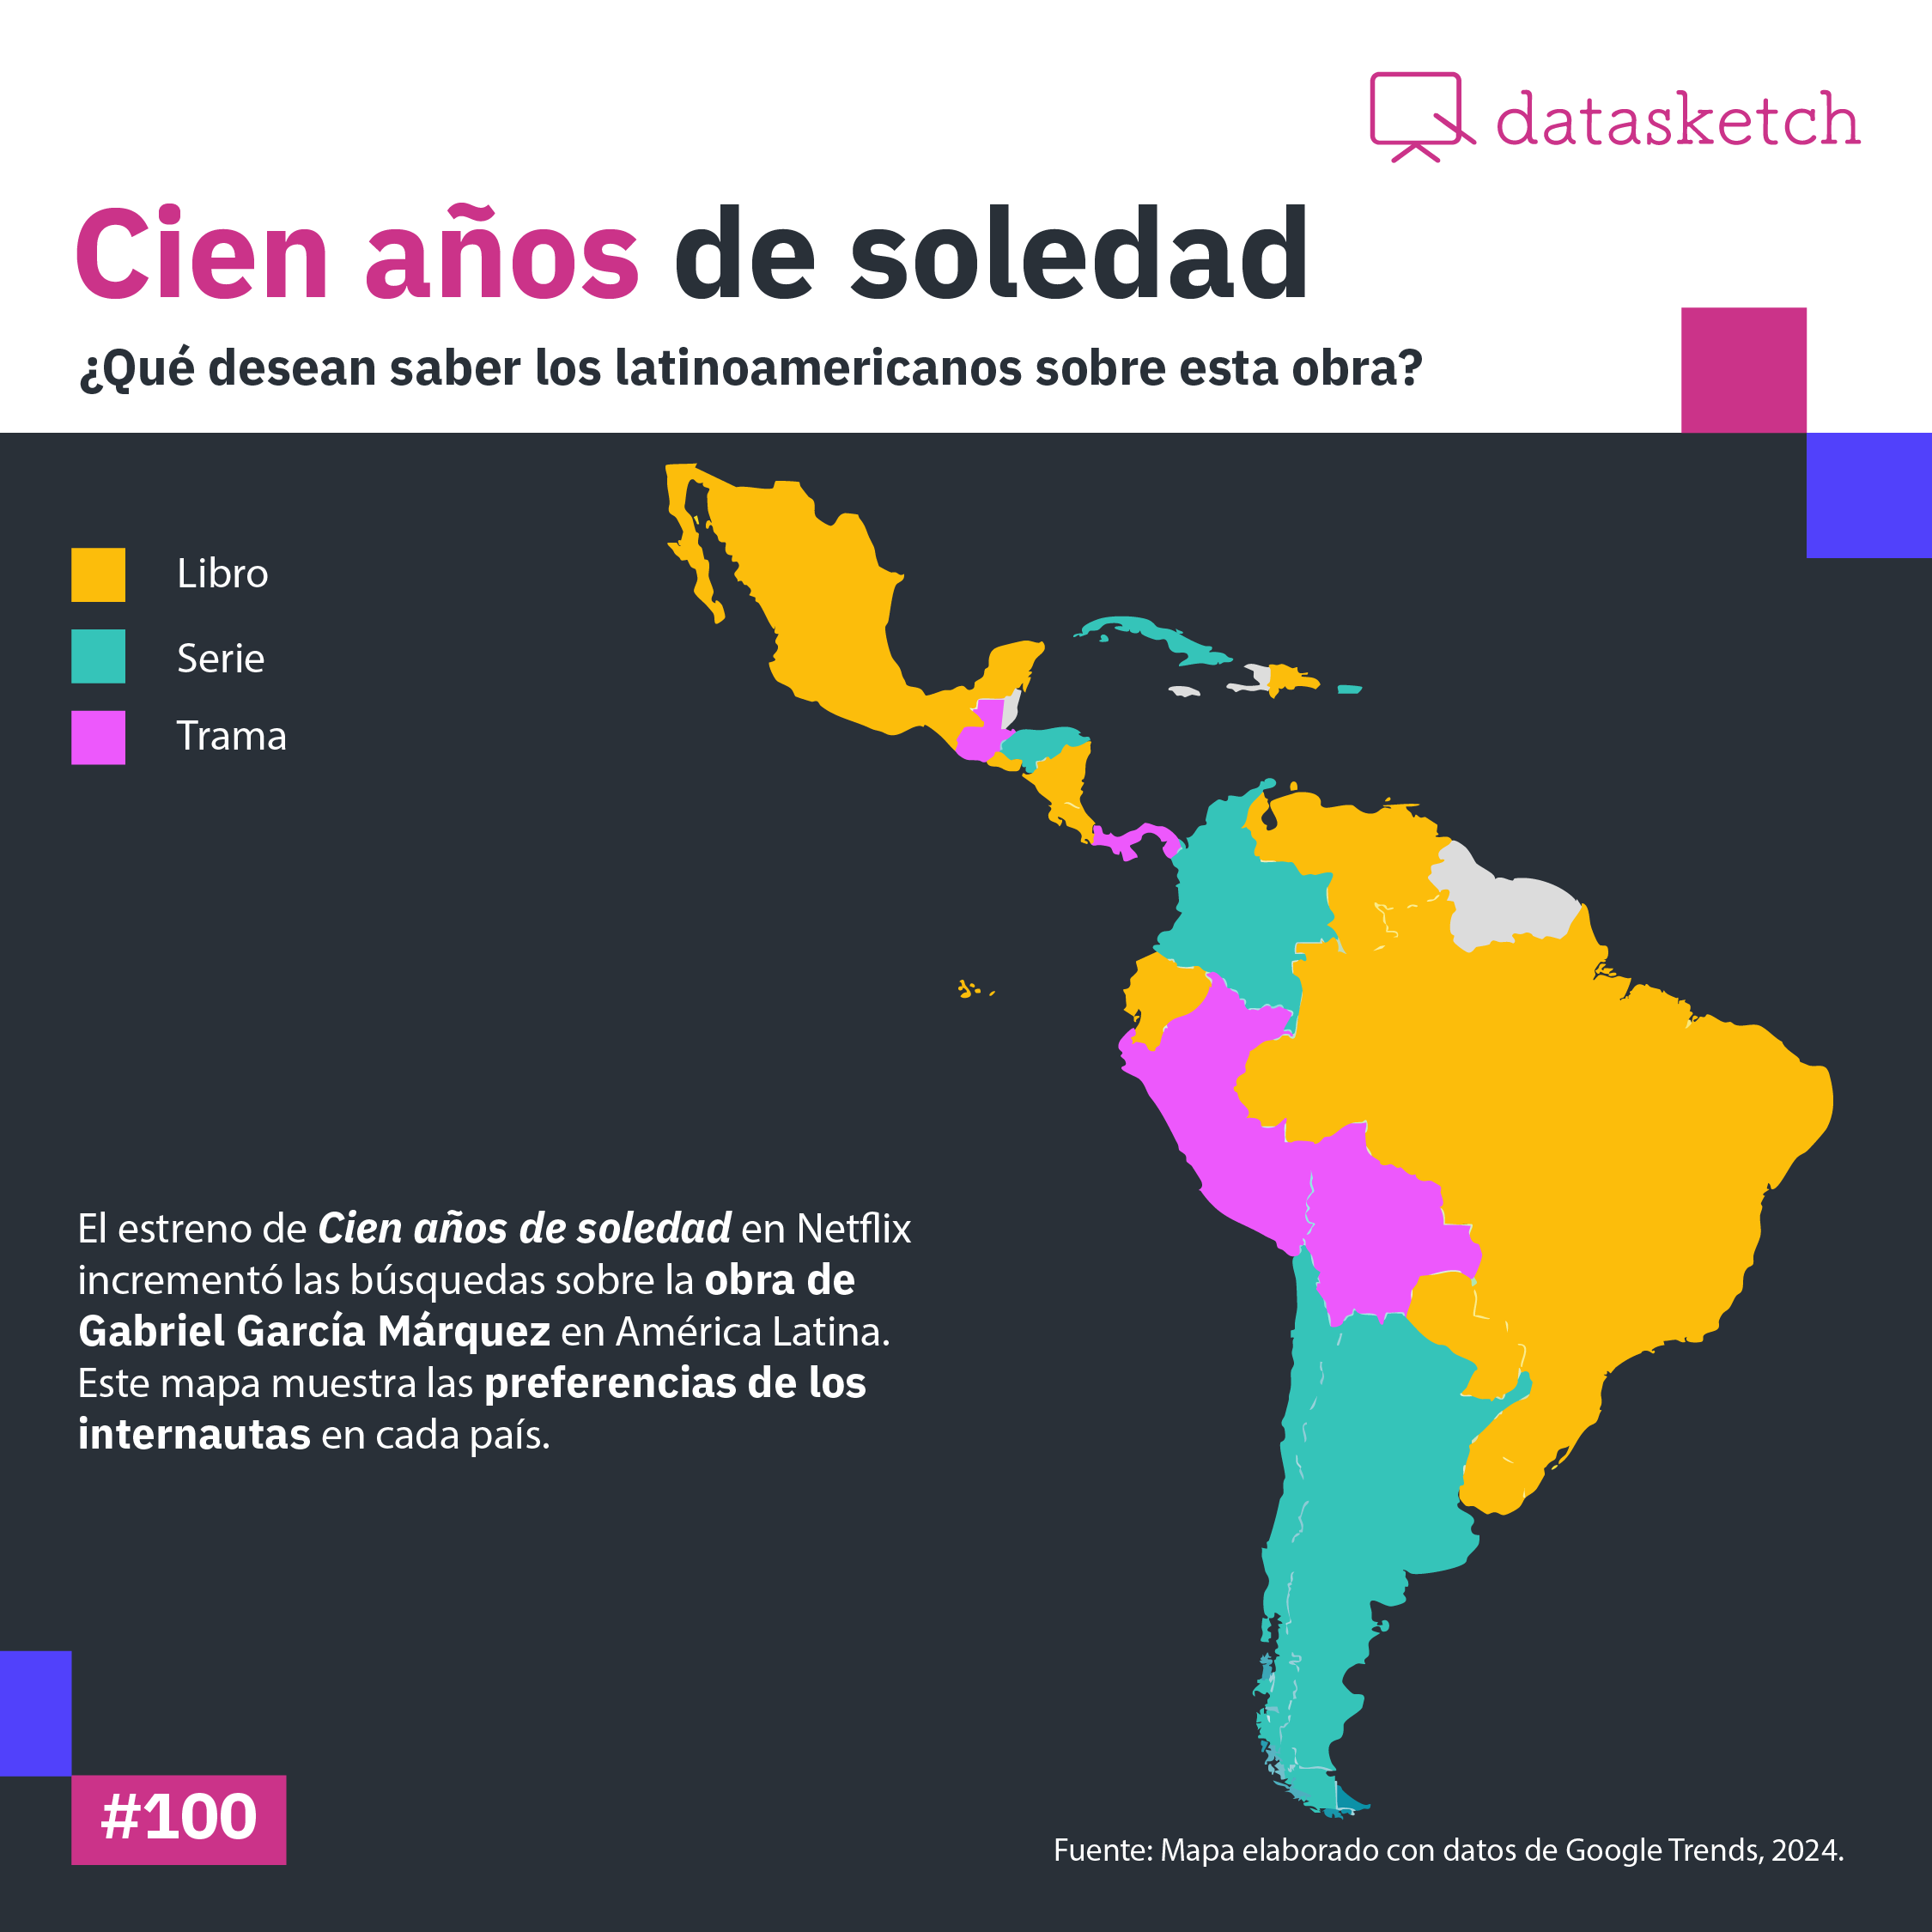
Book or Series? The Interest in Cien años de soledad in Latin America Through Data
The debut of 'Cien Años de Soledad' on Netflix has generated a notable increase in searches related …


Flavors in Data: Discover Traditional Colombian Cuisine's Recipes
Colombian gastronomy knowledge, documented for decades in the Great Book of Colombian Cuisine, …


Challenges for Women in Haute Cuisine
Throughout history, society has linked women to cooking in the domestic sphere, performing roles …

Data Management Challenges for Restaurants
Digital transformation has led restaurants to face an unprecedented amount of information that needs …


How to Create a Website with Excel
Can you imagine creating a website as easily as managing an Excel spreadsheet? Discover how to …


Local Tech Solutions Take Center Stage in the Americas
América Abierta is one of the most anticipated events on open data in the region. In this article, …

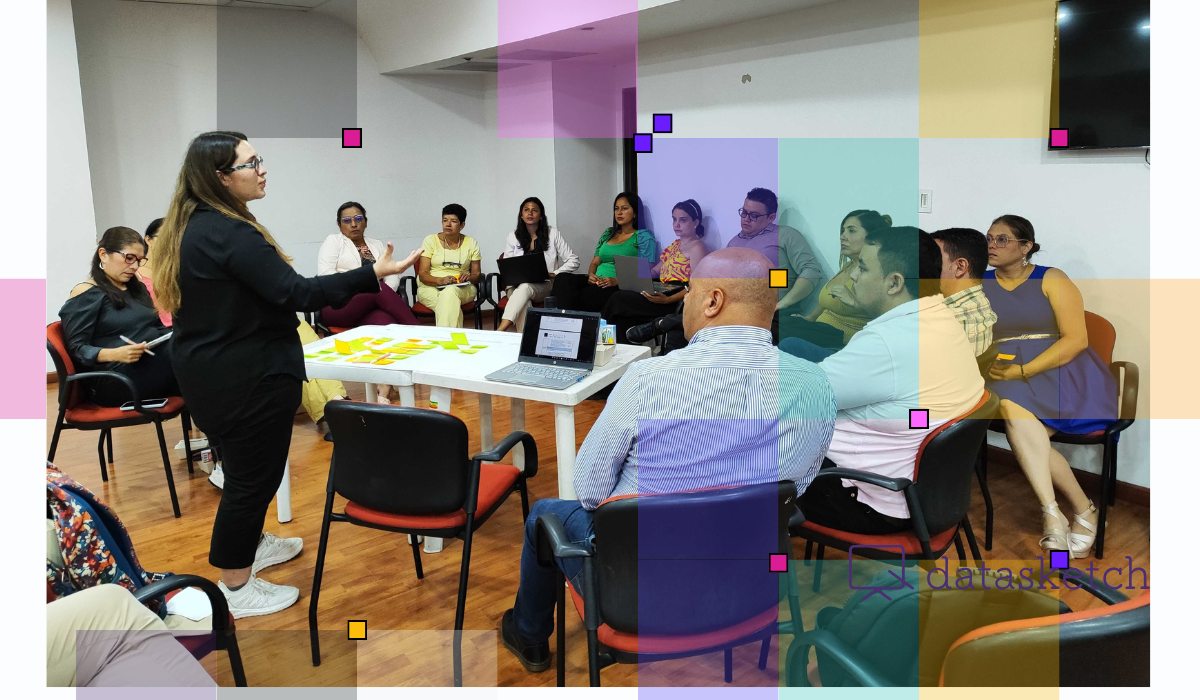
Towards an Open State with a Gender Perspective in Colombia
Colombia promotes open government and incorporates a gender perspective for the first time in its V …

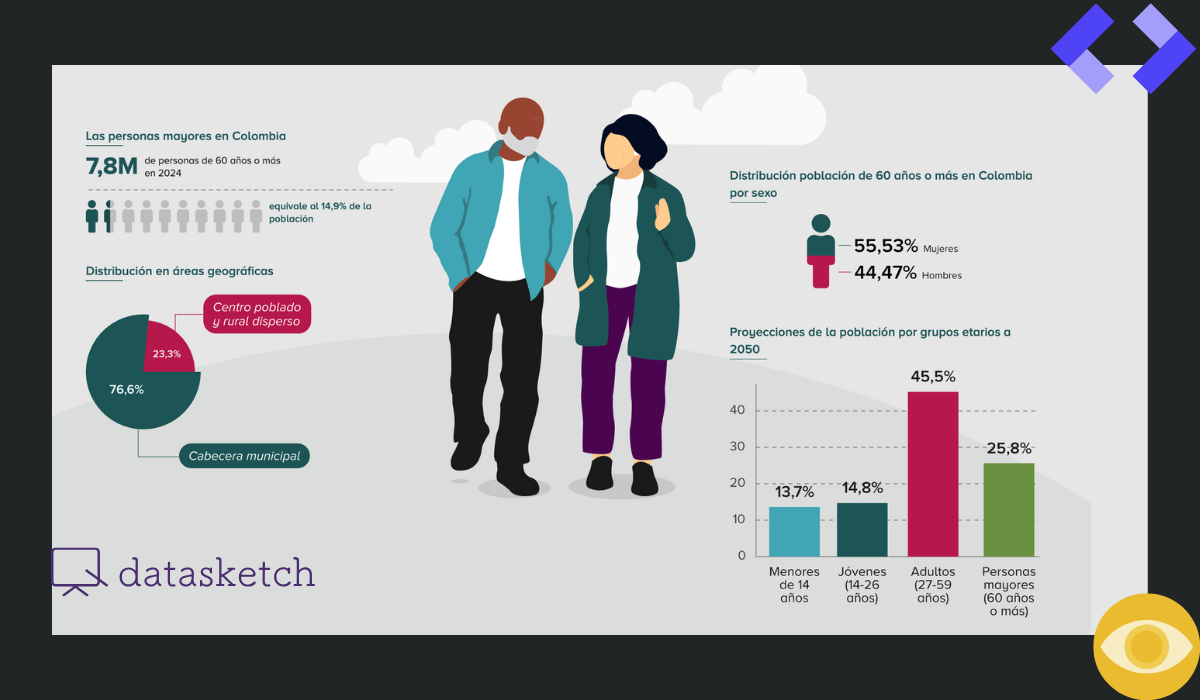
+60 Datos Plateados: Data visualization to improve the quality of life for older adults in Colombia
From November 12 to 15, 2024, Medellín is the epicenter of data innovation as it hosts the United …

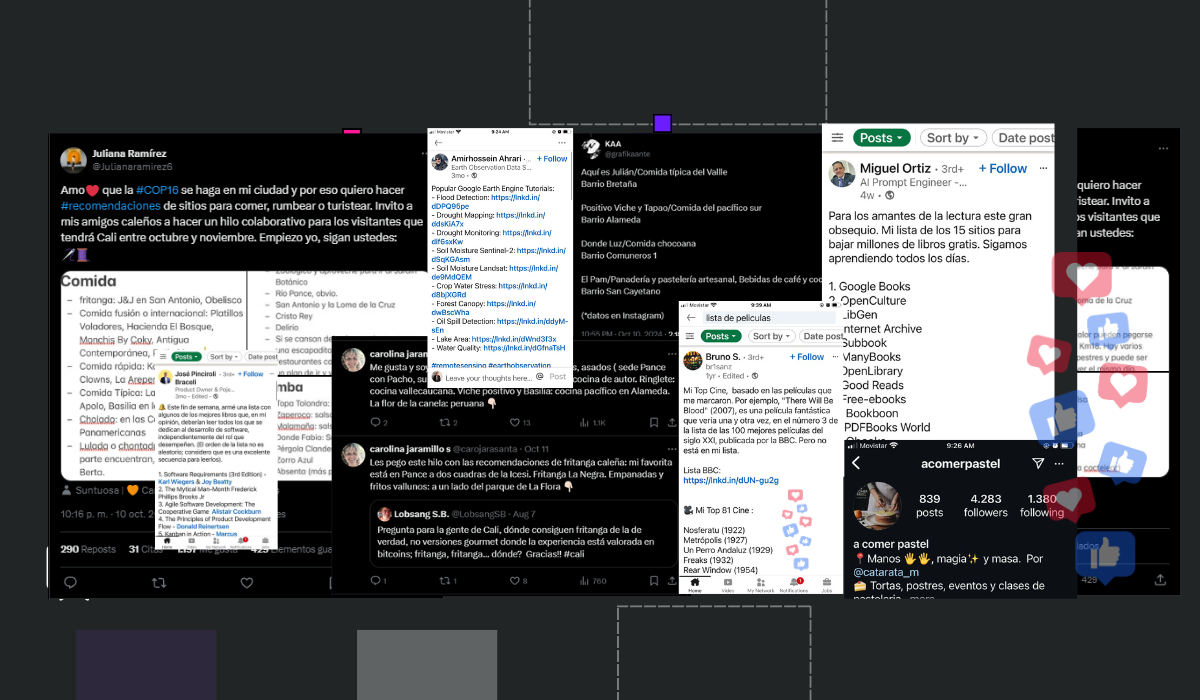
Small Data on Social Media How to Leverage Information for Collective Use
Small data is everywhere on our social media feeds: from saved recipes on Instagram to …

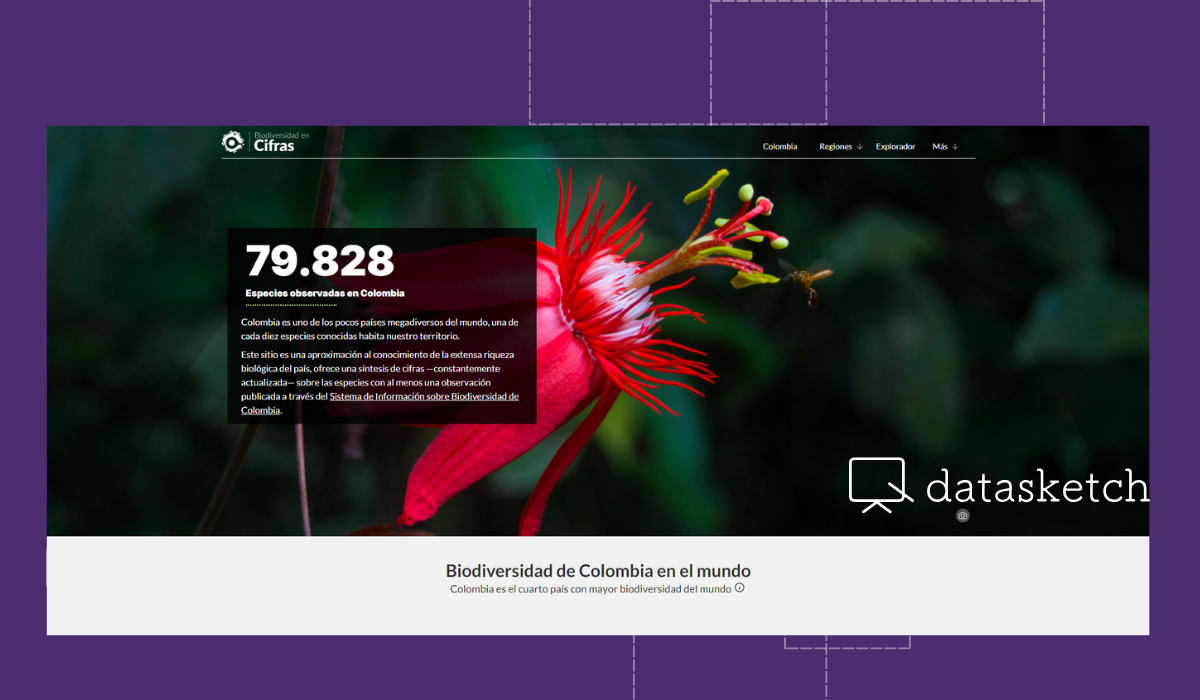
Biodiversidad en Cifras: Open data for conservation in Colombia
Biodiversidad en Cifras is an open data platform that provides access to updated information on …

Creative proposals for visualizing gastronomic data
Data science and artificial intelligence are transforming the gastronomy industry. In this post, we …

Effective Strategies for Inventory Management in Restaurants
In the competitive world of gastronomy, every detail matters. From menu selection to the …


POS Systems for Restaurants
In the competitive world of gastronomy, restaurant technology has become an essential ingredient for …

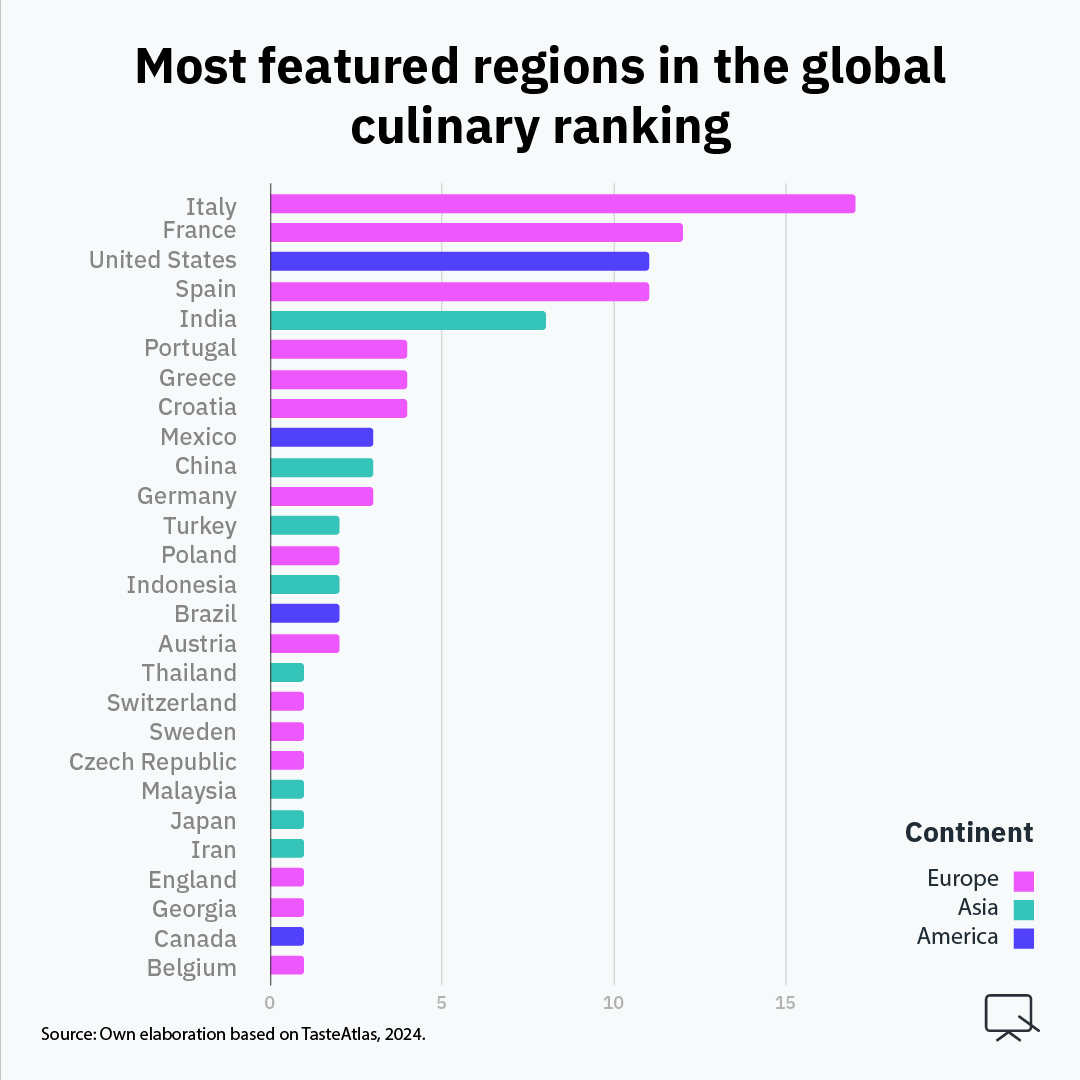
Flavors of the world
The world of gastronomy is vast and diverse, with each region contributing unique flavors and …

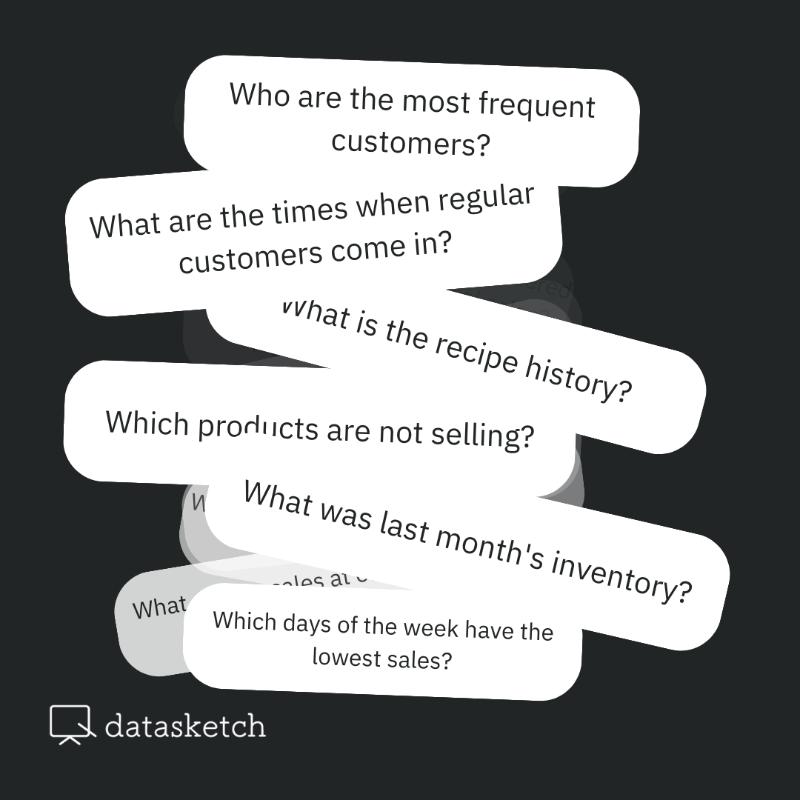
Revolutionizing Small Business Analytics with AI: Datasketch
A tech revolution is brewing for small businesses, and at Datasketch, we’re leading the charge. Our …


Data in the Café Datasketch Menu: Innovation for Gastronomy
At Café Datasketch, we combine gastronomy with data technology. Our menu continuously adapts through …


How to Identify Fake News: Online News Verification Tools
The access to information has undergone a profound transformation driven by the expansion of social …

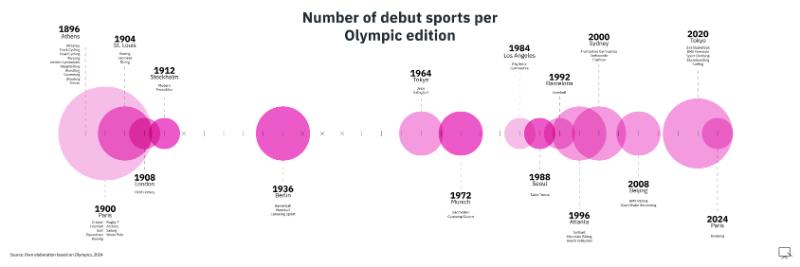
New Olympic Sports: Curiosities you need to know
The Olympic Games are not only a celebration of sport every four years, but also a stage for …

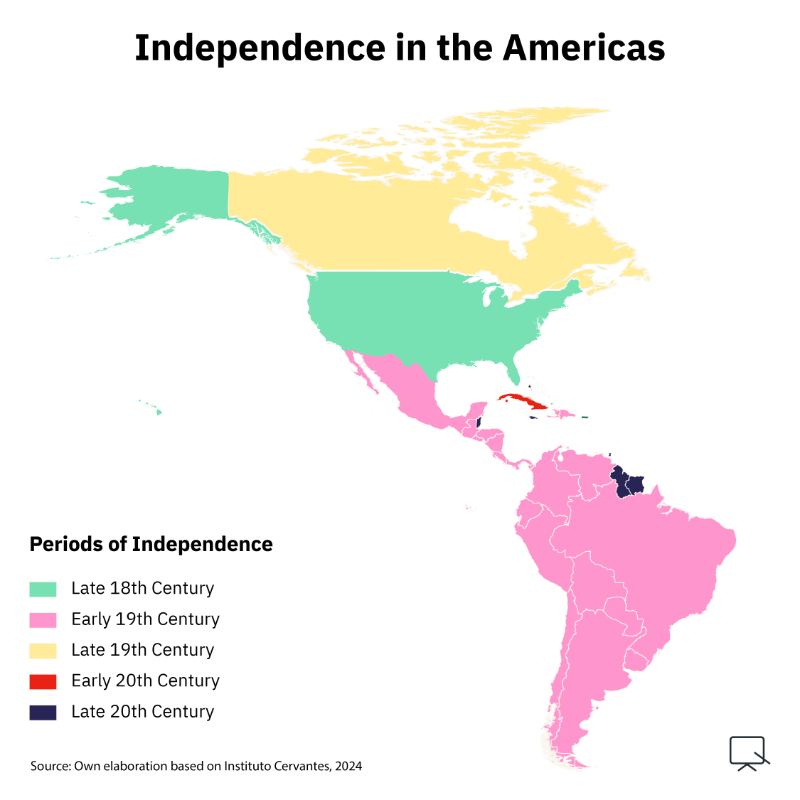
Independence in the Americas: A Historical Overview
When discussing the independences in the Americas, it is essential to go beyond merely knowing the …

5 Types of Visualizations to Enhance Your Infographics
Would you like to learn how to tell stories through data? Here are five visualizations that are not …


Gastronomic Trends 2024: Café Datasketch and Data Technology in Restaurants
In the neighborhood of Quinta Camacho in Bogotá, amidst the aroma of freshly ground coffee and the …

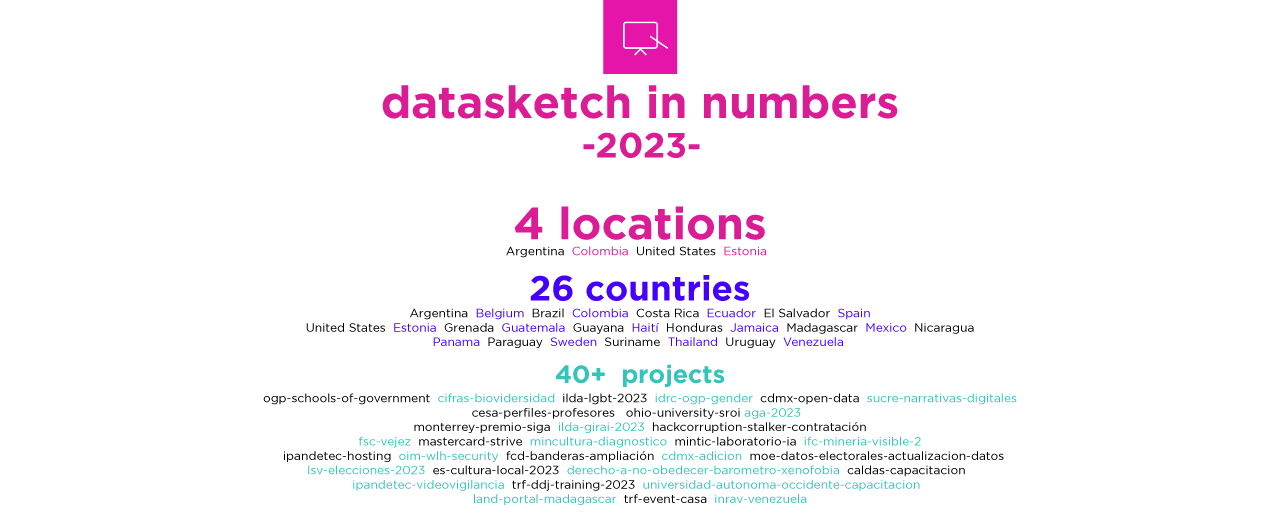
2023 in Numbers - Datasketch Newsletter #42
Data Science | Product | Artificial Intelligence

Advocacy against Violence - Datasketch Newsletter #41
Women | Internet | Rights


Eye on Privacy - Datasketch Newsletter #40
Central America | Video surveillance | Privacy


Technology Solutions in Action - Datasketch Newsletter #39
ABRELATAM | Open Data | CKAN

Accessibility and Visualizations for Social Change - Datasketch Newsletter #38
Visualizations | Artificial Intelligence | Public Procurement

Inform yourself before choosing - Datasketch Newsletter #37
Media | Public Procurement | Elections

Evidence to Propel Journalism - Datasketch Newsletter #36
Investigative Journalism | Civic Technology | Press Freedom

Next stop: OGP Global Summit - Datasketch Newsletter #35
OGP | Action Plan | Inclusion

Rights in Motion - Datasketch Newsletter #34
Migration | Human Rights | Xenophobia


The Economic Outlook - Datasketch Newsletter #33
Economy | Sustainability | Aging

AI Perspectives - Datasketch Newsletter #32
Artificial Intelligence | Work | Journalism

The Horizon of Accessible Information - Datasketch Newsletter #31
Video Surveillance | Older People | CSOs

Diversity as Seen from the Evidence Datasketch Newsletter #30
Diversity | LGBTIQ+ | Latin America and the Caribbean


Proud of These Projects - Datasketch Newsletter #29
Rights | LGBTIQ+ | Americas

Data for Cities - Datasketch Newsletter #28
Cities | Trees | Technology

Pandemic goes, inequalities remain - Datasketch Newsletter #27
COVID-19 | Contracts | Corruption


Carrasco: "To talk about data protection is also to talk about redistribution"
Carlos addresses the challenges of data use in municipalities.


Toward an Open Americas
América Abierta is a regional meeting of diverse communities that seeks to connect actors to work …

There is a future if there is truth
We dedicate a special issue of our newsletters to the final report of the Truth Commission because …

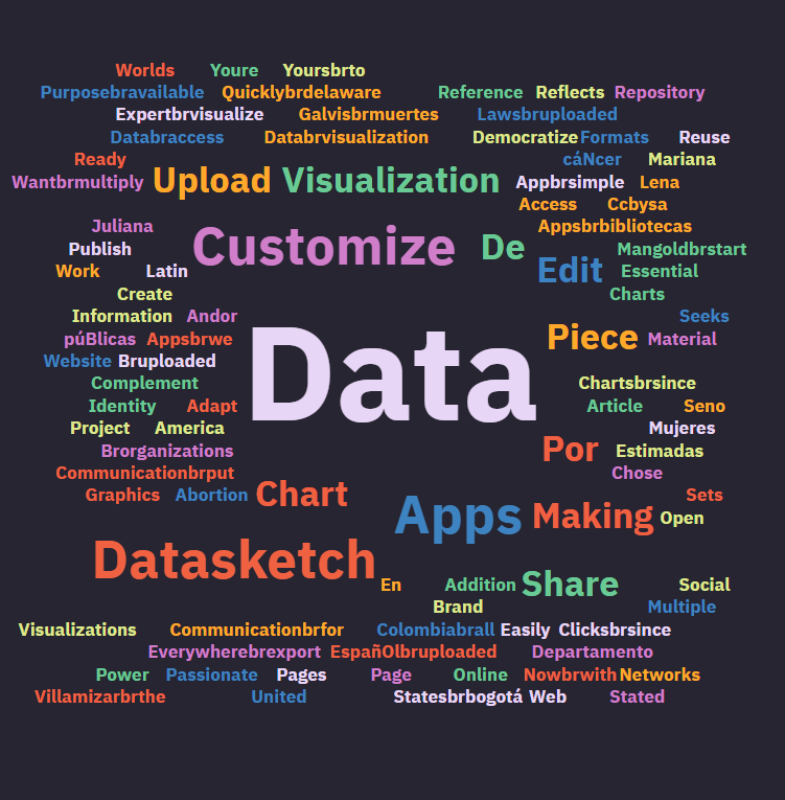
Text Visualization: Word Clouds
Data visualization is usually related to graphical representations of numbers, but when the …


#AccesoALaInformacionYa
Access to public information is a fundamental right for citizens to build better relationships with …


Reflections for Democratic Data Governance in Colombia
We reviewed Colombia's draft National Data Infrastructure Plan, collaborating with the Karisma …


#DataPrivacy
Digital technology promises to speed up processes, but what do we stand to lose when we give up a …


Climate Change is a Matter of Social Justice and Human Rights!
Xiomara Acevedo tells us about young journalists' path to confront climate change and strengthen …

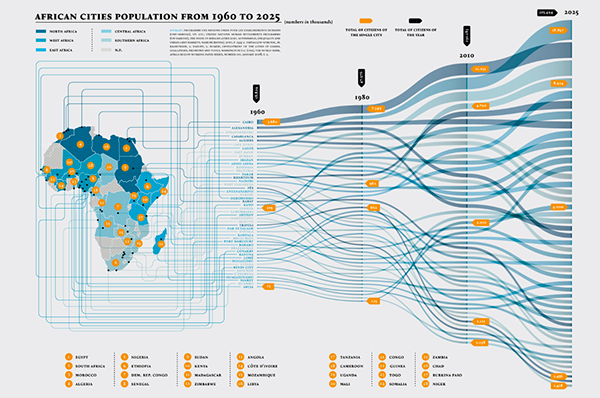
Data Visualization: Alluvial Diagram
An alluvial diagram or alluvial plot is a type of visualization that shows changes in flow over …

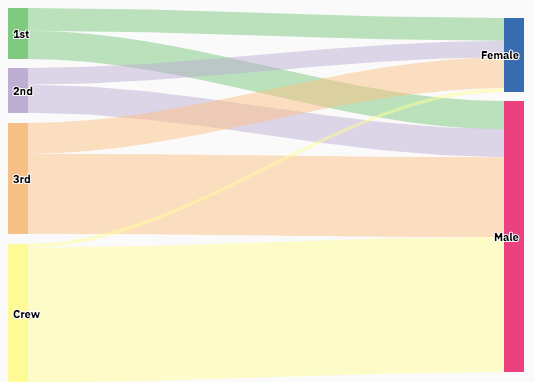
Data visualization: Sankey Diagram
The Sankey diagram is a type of data visualization that allows you to graphically represent the flow …


Copy and paste? The challenges of copyright in the digital world
"Copy and paste" practice, if copyright guidelines are not followed, can become a punishable …

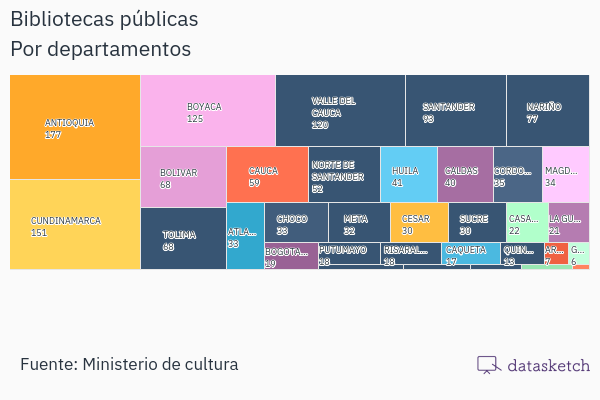
Data Visualization: Treemap
Treemap is a type of data visualization that displays data hierarchically. Here you will find its …


Data Visualization: Bar Chart
We explain to you their characteristics, possible uses, and the different types of bar charts.


Data Visualization: Pie Chart
The pie chart is a pictorial representation of data that makes it possible to visualize the …

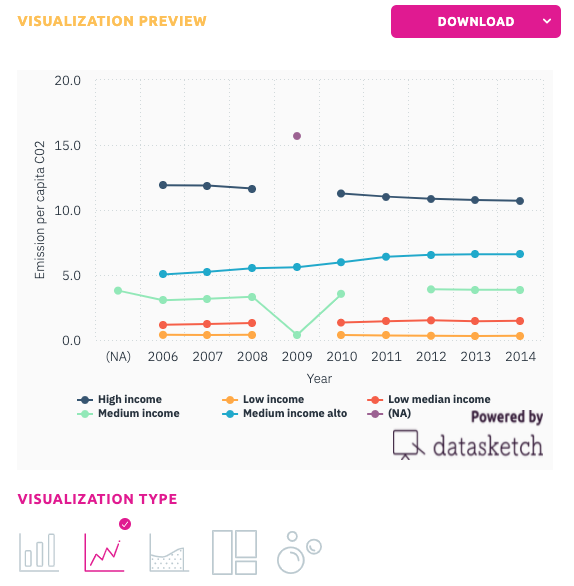
Data Visualization: Line Graph
Learn how to use a line chart and when, its advantages and disadvantages and which of our apps to …

How I got 10.000 emails for launching our newsletter
Tips and tricks to grow your email list from people you already know. Datapreneur.


