Accessibility and Visualizations for Social Change - Datasketch Newsletter #38
Visualizations | Artificial Intelligence | Public Procurement
Available in:

We continue with our events agenda and in the Southern Cone. We move from the Media Party in Argentina to the Latin American Conference on the Use of R in Research & Development, LatinR 2023, October 18-20 in Montevideo (Uruguay) 🇺🇾.
Camila Achuri, data scientist at Datasketch, will talk about {ggmagic}, a library we made to simplify the creation of charts in the {ggplot} data visualization package. The library automatically recommends the most appropriate visualization type based on users' data without requiring them to know technical details. Camila will talk about the challenges in developing {ggmagic} and the lessons learned in the process to share experiences and inspire others. We hope you can stop by the event to share!
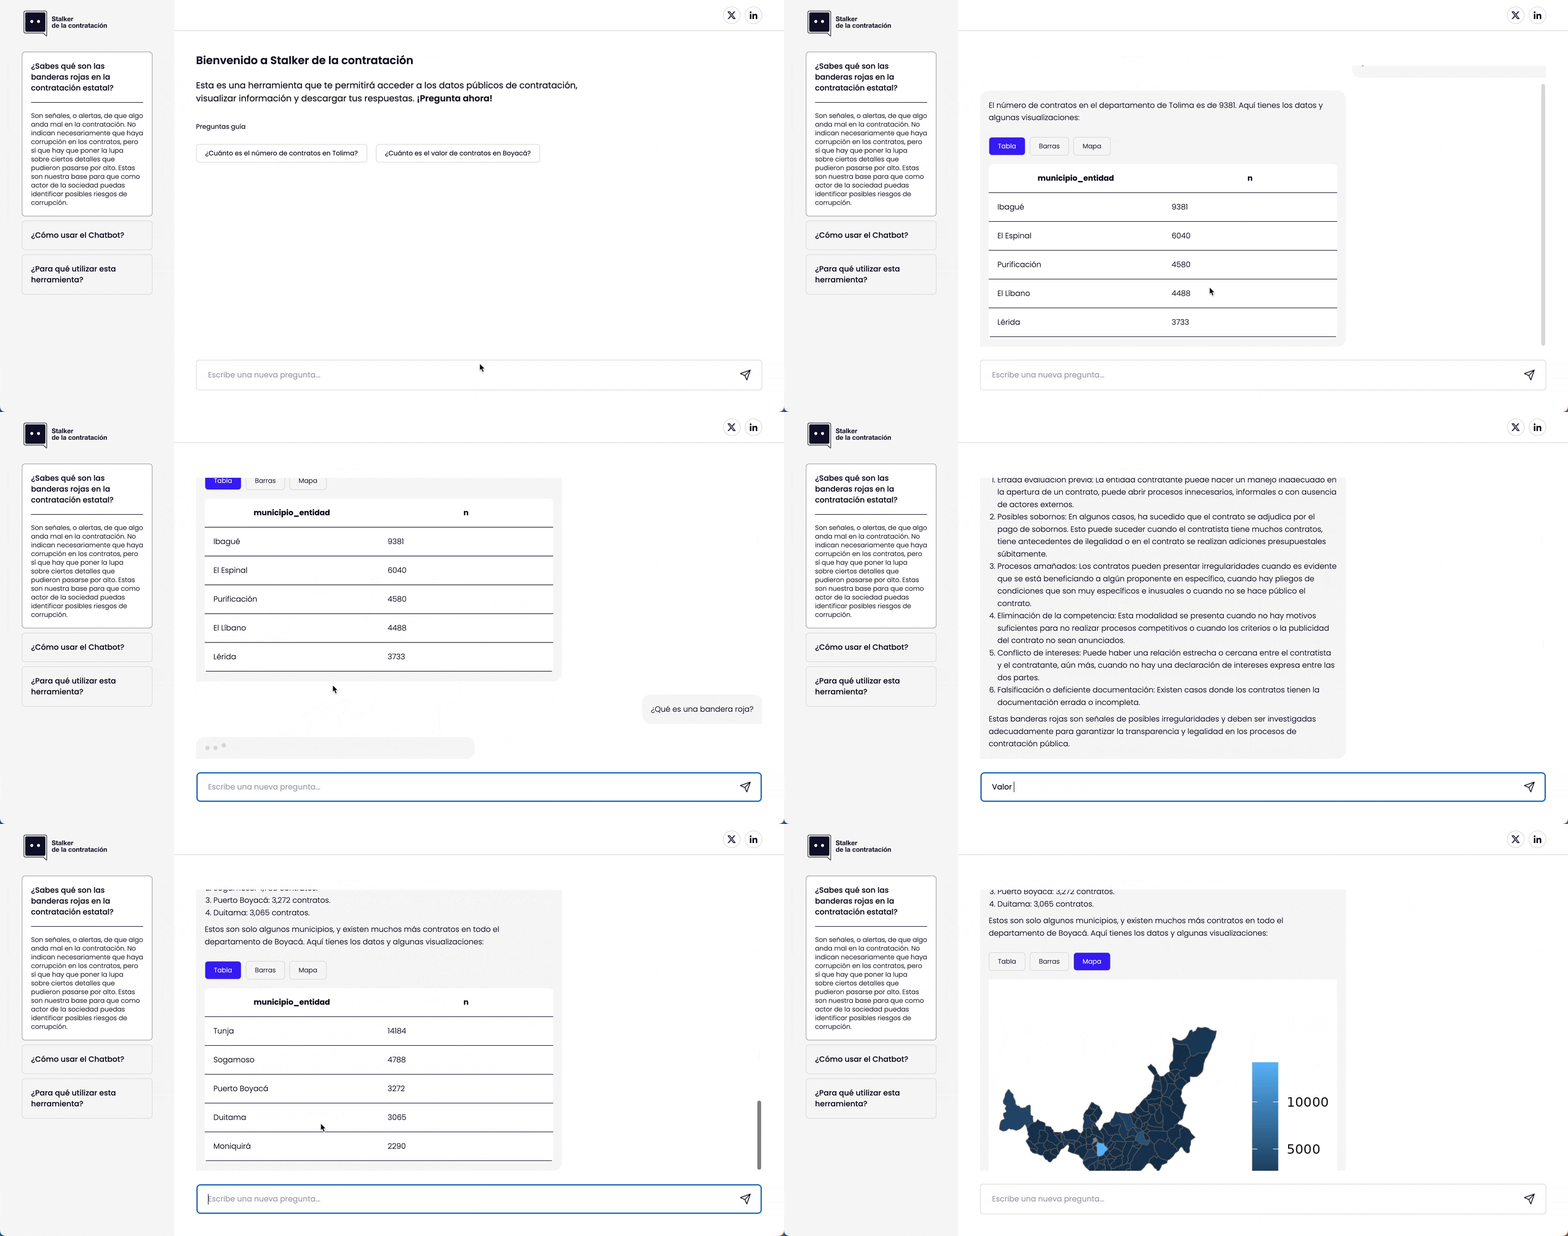
We also implemented the data visualization recommendation in the “Stalker de la contratación,” a chatbot that answers queries about public procurement in Colombia. After perfecting it at the Hackcorruption Bootcamp, we’re eager for your feedback - we invite you to register and try the demo!

Open Government by Design
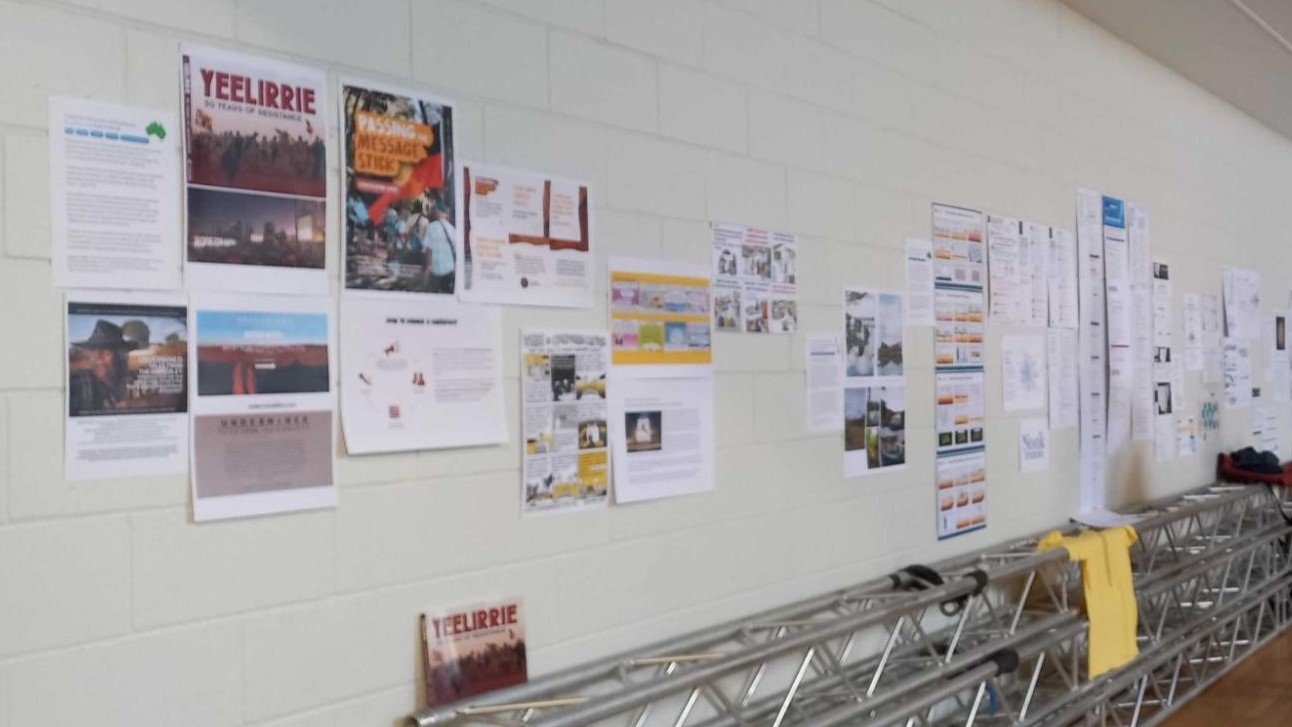
In collaboration with Nook Studios, we did the gallery and workshop “Making Government Open: Inspiring Positive Change with Stories and Design” at the Open Government Partnership Global Summit, which took place in Estonia in September. Now, we want to tell you what we discussed.
We explored the power of information in communities and how digital tools can bridge gaps in language, accessibility and inclusion. Attendees recognized the importance of collaborating with artists and visual storytellers to promote language learning and strengthen cultural ties. Similarly, we encouraged the inclusion of people with disabilities, focusing on awareness and government support.
The workshop highlighted the importance of data and visualization in addressing social and environmental issues. As such, we encouraged the use of these tools and creative collaboration to achieve visual representations. We also advocated for policies that promote transparency and innovative data visualization in government and civic initiatives.

On the radar 📡
- 🌏 How AI reduces the world to stereotypes: Rest of World analyzed 3000 AI images to see how imagers visualize different countries and cultures | Rest of World
- 🗽 Freedom on the Net 2023: The repressive power of artificial intelligence | Freedom House
- 🎧 The story of “Volver al corazón”, the album by singer Leiden together with women in prison in Mexico, which was supported by the Voice2Rep program to create links with singers who have a strong social commitment | Accountability Lab (We thank Ingrid Löwenberg for telling us about this musical project ❤️)
- 🇪🇺 Open data as an enabler for regional development and better cohesion in Europe | The official European data portal
- 🗓️ Menstrual Cycle Length and Variability: A Visual Explanation | Apple Women’s Health Study
- 🙋🏾♀️ Call for Proposals: Feminist Approaches to Fighting Corruption | Global Fund for Women
- ⛰️ Generator of joy plots based on the population density of each country | Baryon (We learned about this project from Juan Esteban Ospina, from CORLIDE, another of the civil society organizations that make up the Open State Committee in Colombia)
- 🇺🇾 Agenda of ABRELATAM/CONDATOS 2023, October 31 to November 3 in Montevideo, Uruguay | ABRELATAM/CONDATOS
Your reading makes us very happy and we appreciate your sharing this issue with others. We would also like to hear about your projects to tell you how we can contribute to making them a reality. Do not hesitate to contact us at sales@datasketch.co to schedule a call.


