Visual Cartographies: From Encyclopedia to Videogames - Data Culture #11
The must-sees of culture and data. April 2022.
Available in:

We share with you this week’s must-sees. Start with the digitization of the Iconographic Encyclopedia. Continue with the fluctuating paths of Black Elevation Map’s cultural map. Enjoy our four recommendations for this week. Finally, you’ll find the data plus and an invitation to read our culture and data blog post on Datasketch.
If someone has forwarded you this newsletter, and you like it, you can subscribe here. You can read it in your browser. Puedes leer la versión en español aquí. Check out our blog and newsletters if you like data journalism, open government, and culture.
Iconographic Encyclopedia
Between 1849 and 1851, German publisher Johann Georg Heck published his collection of illustrations ranging from astronomy to zoology. This year, data artist Nicholas Rougeux launched the digital edition of the Iconographic Encyclopedia of Science, Literature and Art. The Encyclopedia includes more than 13,000 illustrations from 500 engraved steel plates and more than 1.6 million words of descriptions.
This arduous work began in late December 2020 and, over the course of a year, Heck’s 500 plates were restored one by one from the original scans. Read more about the process of digital creation of the Encyclopedia here.
![]()
Black Elevation Map
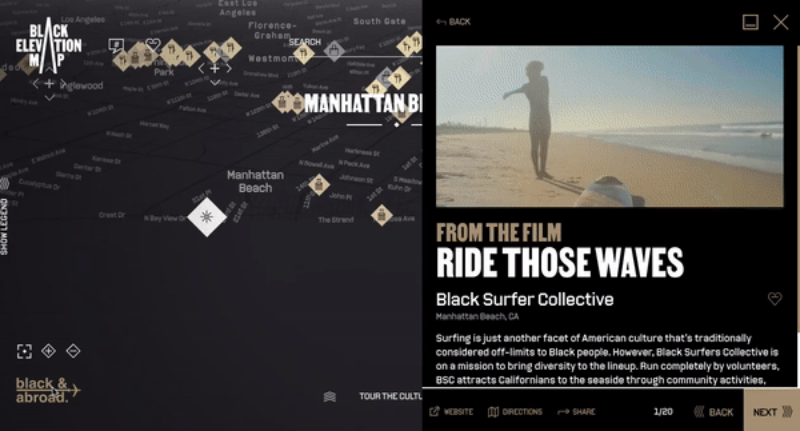
Black Elevation Map is an immersive digital experience that re-imagines the American landscape by putting the focus on visualizing cultures as elevation. The platform collects diverse datasets of black population, historical markers, and social networking activities and visualizes them with points of interest on a dynamic, searchable elevation map.
Historically, maps have been used to marginalize and divide communities in all parts of the world. This project seeks to help travelers see America from the contributions and celebrations of the African American community, weaving together the amalgamation and depth of interpretation of black data and voices.

Things we like
In this space, you will find recommendations selected by the women of our team. Here you will find events, visualizations, exhibitions, exercises, images and GIFs that intertwine data, culture and social movements.
Culture and Data
- 📚 Dataviz books Everyone Should Read. Here you’ll find the books every Dataviz follower needs to read, from “Atlas of the Invisible” to “The Grammar of the Graphics”.
- 👖🗑 The Global Glut of Clothing Is an Environmental crisis. If you’re a fan of secondhand clothing, you’re going to love this article. If you’re not, it will give you reasons to consider it.
- 🎥😷 Chalamet Coughs, Dune Wins: Predicting Best Picture Winners Using Coughs and Sneezes. Is it possible that there is a link between the amount of sneezes and coughs and winning the Academy Award for Best Picture? We share with you a little sneezing and coughing humor and data science.
- 🗺🚗 Google Maps Hacks. This performance by Simon Weckert hacks the monitoring, control and regulation techniques of Google Maps.
Data Culture and Datasketch
Data culture has been understood and used to make decisions in organizational processes. However, it is more than that. We live immersed in the data culture, even if we don’t realize it. Data goes beyond the business field, where it is used to impact the production, management, and consumption process. Data has been incorporated into everyday practices.
Continue reading here.

Data plus: Atractor
Atractor is a group of artists who work with mechanical, electronic, and computer engineering techniques. Their artistic bet is framed in natural phenomena, mathematical paradigms and their relationship with culture and society. They understand technology as a field of dispute from their Latin American context. A recurring means of visual expression in their projects is the video game, as they consider it a tool for interaction that allows them to adopt the point of view of the game’s character. “Los Migrantes” will bring you closer to feathers and wings.

That's all for now
Subscribe to our newsletter! You will receive our content directly in your inbox.
We have other content that may interest you in our blog and newsletters.


