Press Freedom and on the Way to Innovation - Data Journalism #13
Freedom of Press Special. May 2022.
Available in:

In this issue, we come with good news!
We have been selected to be part of Elevate, the news business hub of the International Center for Journalists (ICFJ). It motivates us to learn and grow by being one of the six Latin American organizations participating in the first cohort.
We will take this opportunity to strengthen the link between data science, journalism, and democracy in the region through our apps, tools, and services.
Being on this list next to media such as Maldita.es (es), Vox Europ (fr), or Agencia Ocote (gt) is a privilege that shows us that we are on the right track.
Journalism under digital siege
May 3 marked an important day for journalism: World Press Freedom Day. It recognizes the need for a free, pluralistic, and independent press to ensure democracy.
The theme chosen for 2022 focuses on the safety of journalists. With the development of artificial intelligence, surveillance systems, and information gathering, the context of technological advances can put people’s integrity at risk, and urgent measures are required.
#WorldPressFreedomDay - #WPFD2022

Source: World Press Freedom Day - EN | United Nations
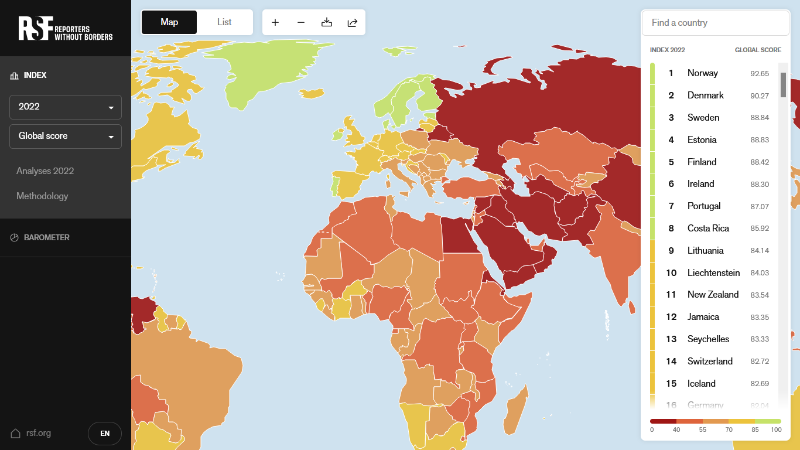
World Press Freedom Index
Reporters Without Borders (RSF) launched the World Press Freedom Index. It is the twentieth edition of the Index, which evaluated 180 countries and territories. It has a new methodology, with a redefinition of press freedom, five new indicators (political context, legal framework, economic context, sociocultural context, and safety), and a reformulation of the questionnaire, taking into account the digitalization of the media.
According to the findings, polarization doubled due to the chaos in information, i.e., false news and propaganda. RSF pointed out that this is happening both locally and internationally, with cases like the United States, as well as Russia and Ukraine.
The Index argues that a democratic context makes press freedom and the right to information possible. On the contrary, authoritarianism suppresses rights, increases tension, and fosters war, as can be corroborated today. Faced with this situation, RSF proposes a legal framework for public debate.
Read more (button)

Source: Index | RSF
Spying against democracy and free press
Even in democratic countries, press freedom is at risk when espionage networks exist. Spying can weaken public confidence, lead to manipulation of information, disseminate false news, and even jeopardize the international relations of countries.
The New Yorker warns on this point in its report on the use of Pegasus. This software is being used to spy on politicians and social personalities, following the latest cases reported in Spain.
A few weeks ago, Spain was alerted about the illegal spying on public figures close to the pro-independence movement. In a press conference, the Government announced that the President and the Minister of Defense had also suffered attacks.
Read more about the risks of data misuse, which violate people’s privacy and puts them at risk, in the 12th edition of the Open Government newsletter.
Data as a solution to regional problems
Ivette Yáñez and Nicholas Benequista wrote an article that compiles data on global trends in freedom of expression and media development. Yáñez and Benequista drew from the recently published Unesco Global Report 2021/2022.
Despite the murders of 123 journalists in Latin America and the Caribbean between 2016 and 2021 and the challenges in carrying out their work, the media continue to report. Yáñez and Benequista sweep through several data-driven investigations in the region, many of which we have covered in previous issues of this newsletter.
The article points out that solutions must come from understanding the problems, which can only be achieved through measurement and monitoring. Quality data is an essential resource.
Promoting the use and openness of data guarantees freedom of the press.
Dataviz: environment
Data-driven advocacy helps promote press freedom, as does witnessing the climate crisis.
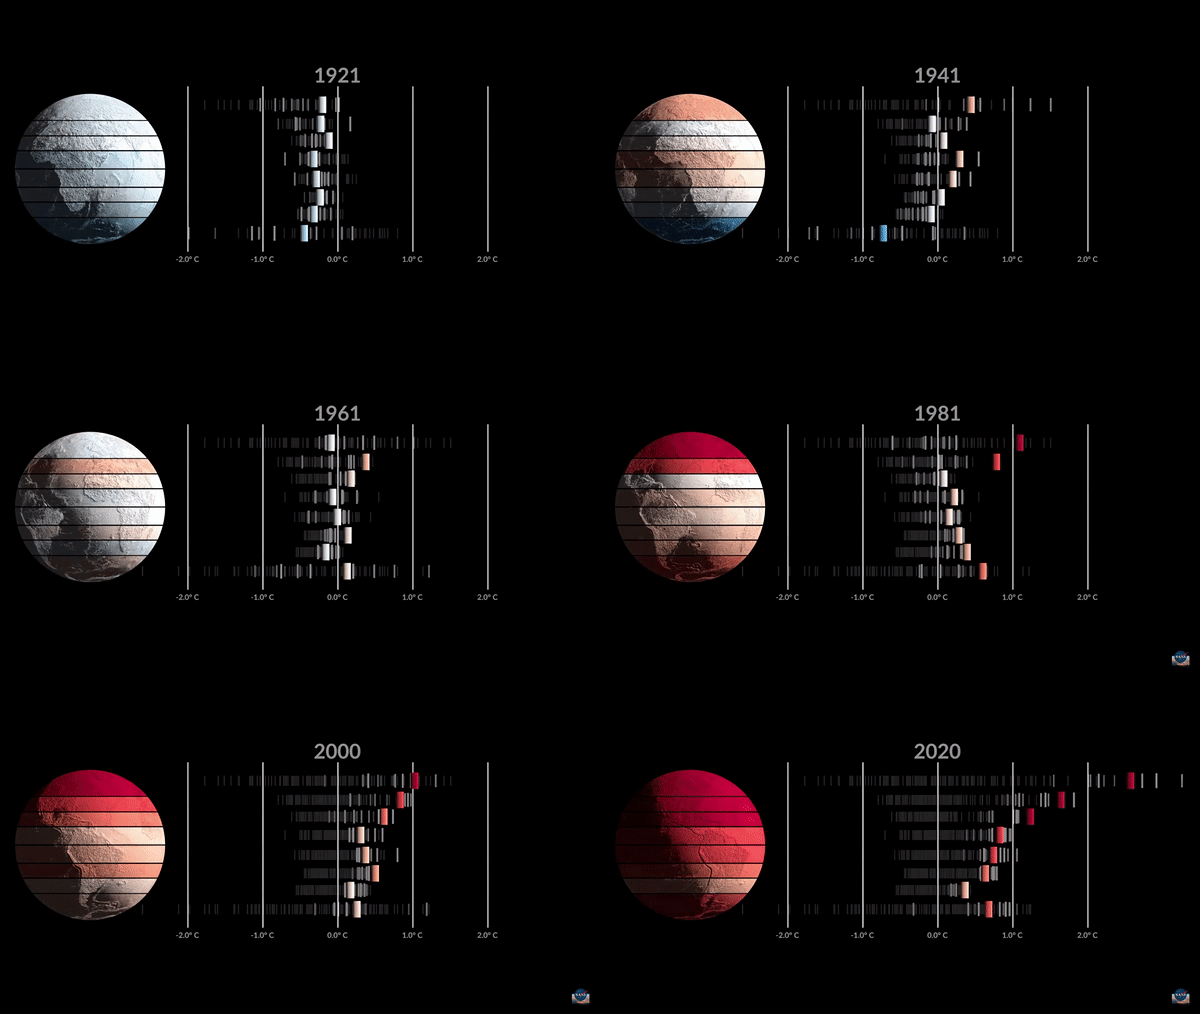
In this visualization, NASA’s Science Visualization Studio showed global warming disaggregated by latitude groups from 1880 to 2021. The bar-coded chart of temperatures and their representation on the globe show that warming is higher in some parts of the earth, such as the Arctic.
The data is available on the page for you to reuse. From Datasketch we can be great allies or suppliers to create eye-catching and revealing ways of reporting.

Source: Video: Global Warming Broken Down by Latitude Zone (1880-2021) | NASA
Datatip
Always think about how to create genuinely inclusive designs. It’s challenging, but it can be easy to make it part of your work routine.
Frank Elavsky, a researcher at the Human-Computer Interaction Institute, gave five very practical tips, including the use of language, interactivity, colors, programming, and navigation.
“I am dreaming of a future where these 5 things are as common of discourse as things like the ‘data-to-ink ratio’ or making your color choice ‘colorblind safe.’” he said on his Twitter account. We dream it too.
Save the Date
From April 15 to June 15, the #WikiForHumanRights2022 campaign will take place on the implications of the right to a healthy environment.
Contributing to Wikipedia on this topic, which should always be on agendas, “helps the public make the thousands of decisions needed to address these pressing environmental crises,” the call explains.
Want to read more?
Climate Change
- 🎮 The Climate Game - Can you reach net zero? | The Financial Times
- 🌦️☀️ #ShowYourStripes | Leipzig fürs Klima
Open source research data
Dataviz
- 🐧 Penguin diagram | Wikipedia
- 🏪 Convenience stores on every corner | Datawrapper Blog
See you next time!
Subscribe to our newsletter! You will receive our content directly in your inbox.
Nicolás Barahona, Juan Garnica, and Laura T. Ortiz wrote this newsletter. Learn about data journalism, open government, and data culture in our blog and newsletters.


